
Entering the third quarter, the market is digesting a mixed bag of economic signals. We have just passed the July 4th holiday weekend, marking a shift in trading volumes and a pivot toward upcoming Q2 earnings reports. Over the weekend, the Japanese Yen breached critical support levels, putting significant focus on Japanese markets and global currency dynamics.
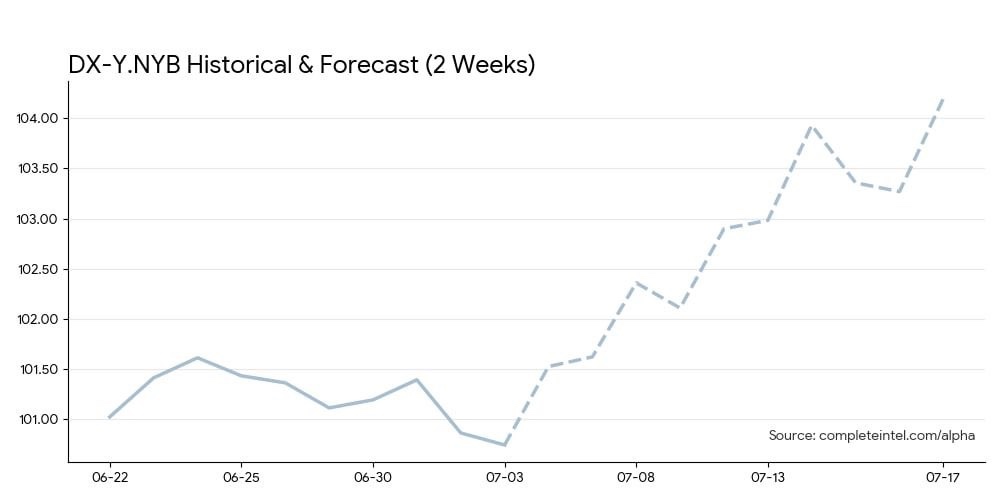
Based on this macro environment, CI Markets is tracking a clear macroeconomic reaction. We are watching a steady rise in the US Dollar, a corresponding rally in Japanese equities, and a healthy consolidation in the US tech sector.
▲ The Currency Driver
The US Dollar is establishing steady strength, but the underlying driver is a structural liquidity squeeze rather than passive inflation metrics. The main catalyst is the supply restriction outlined by the Fed. Plans to trim the central bank balance sheet are actively removing dollars from global circulation, creating an organic shortage of greenbacks. This supply drop is matched by a strong global demand pull. Europe’s escalating trade dispute with China is shifting capital away from the Eurozone, while the structural depreciation of the Yen keeps the Dollar heavily favored. Furthermore, the clear display of US policy leverage following the G7 summit continues to anchor international capital firmly in dollar assets.
▲ Japanese Equities Respond
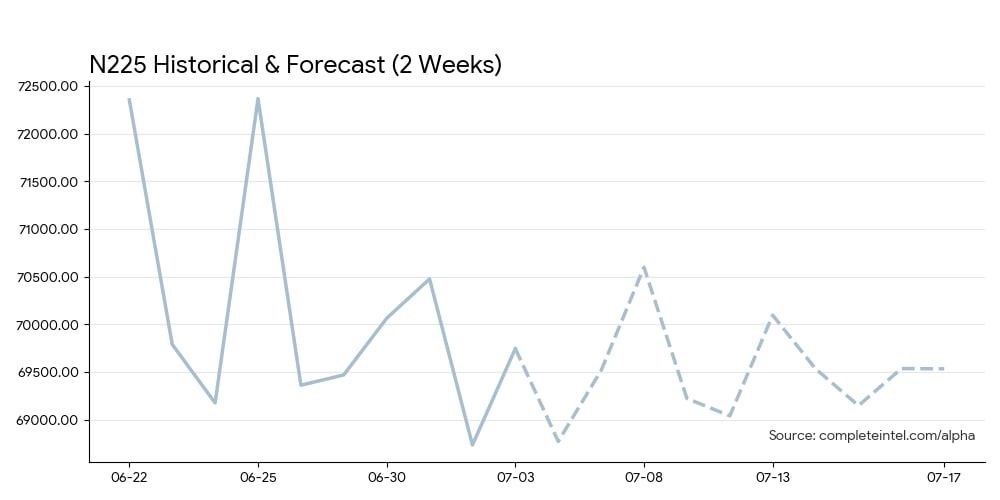
The weekend news regarding the Japanese Yen breaching important psychological levels serves as a major macroeconomic anchor. A weaker Yen traditionally makes Japanese exports more competitive, providing a steady tailwind for their major indices. The CI Markets forecast for the Nikkei 225 shows a distinct rally to open the week, pushing up toward the 70,500 level by Wednesday before cooling off. This move perfectly illustrates how the equity market is directly reacting to the latest currency shifts.
▲ Tech Sector Consolidation
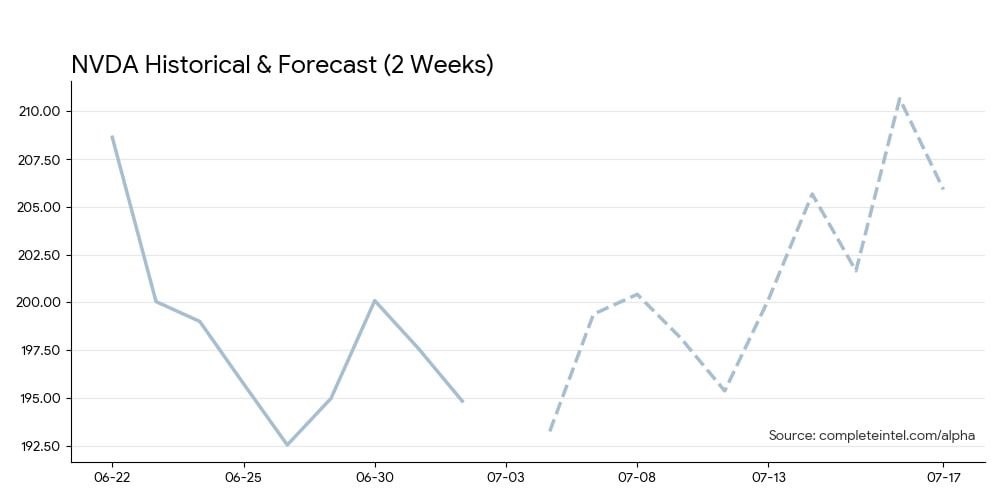
Mega cap tech stocks carried the broader market through the first half of the year. As we enter a new quarter, investors are deciding whether to lock in gains or maintain their exposure. NVDA provides an excellent example of a sober tech sector rotation. The forecast points to a consolidation period, projecting the stock to hover in the mid to upper 190s after struggling to break firmly past the 200 mark. This indicates that capital is taking a breather and rotating to other sectors rather than chasing previous momentum.
Conclusion
The signal for the week of July 6 is currency driven rotation. Persistent US Dollar strength is weighing on the Yen, which in turn supports a rally in the Nikkei 225. Meanwhile, US mega cap tech names like NVDA are entering a period of consolidation as investors evaluate Q3 positioning.
The Wildcard: Keep a close watch on any unexpected interventions by the Bank of Japan, as this could rapidly reverse the current currency trends.
Subscribe to CI Markets Alpha for Daily-Interval Forecasts
No contract. Cancel anytime.
The content presented in this note is for informational purposes only and should not be construed as investment, financial, or trading advice. This analysis is generated from the output of Complete Intelligence’s proprietary artificial intelligence platform and does not constitute a personal recommendation. You should not base any investment decision solely on this material. Please consult with a qualified financial professional before making any investment decisions. Complete Intelligence is not liable for any actions taken based on information provided herein.