Tag: Weekly Outlook

  • Week of July 13, 2026: CI Markets Weekly Outlook

    CI Markets — Weekly Outlook

    Week of July 13, 2026: CI Markets Weekly Outlook

    Complete Intelligence · Published July 13, 2026


    As we navigate the heart of the summer trading session, the Q2 earnings season is fully underway. The broader market continues to recalibrate to resilient economic data and shifting central bank timelines. With technology stocks taking a necessary breather, capital flows are revealing an interesting dynamic between interest rates, domestic housing finance, and traditional safe haven assets. Based on this macro environment, CI Markets is tracking a clear upward push in long term yields, a localized recovery in housing finance, and a muted response from precious metals.


    Forecast: 10-Year Treasury Yield (^TNX) Trend Up 🔼

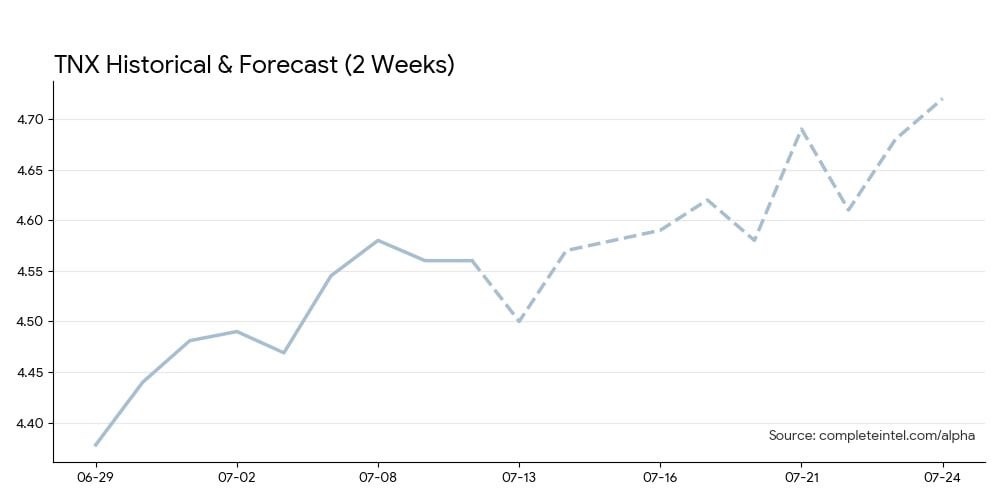
    The bond market continues to search for equilibrium. After a brief period of consolidation in early July, investors are once again adjusting to the reality of sticky economic metrics. CI Markets forecasts the 10-year yield to climb steadily this week. The model projects the yield rising from the mid 4.4% range up toward 4.6% by Friday. This upward trend clearly signals that the market is actively pricing in a prolonged period of elevated interest rates as we move deeper into Q3.

    ^TNX Chart

    = Forecast: Fannie Mae (FNMA) Trend Sideways ⏸️

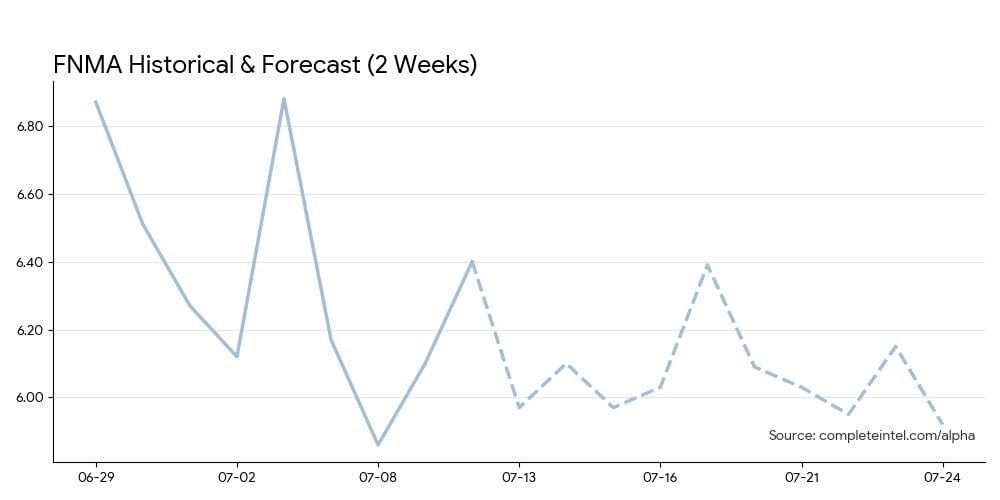
    The mortgage market is highly sensitive to the 10-year yield. As the benchmark yield climbs, mortgage rates are pressured higher, creating immediate headwinds for housing finance. However, CI Markets forecasts Fannie Mae (FNMA) to weather this pressure. The model shows the stock attempting to build a solid floor early in the week before bouncing back by Friday. This suggests that despite the macro pressure of rising yields, specific domestic financial institutions are finding support.

    FNMA Chart

    = Forecast: iShares Silver Trust (SLV) Trend Sideways ⏸️

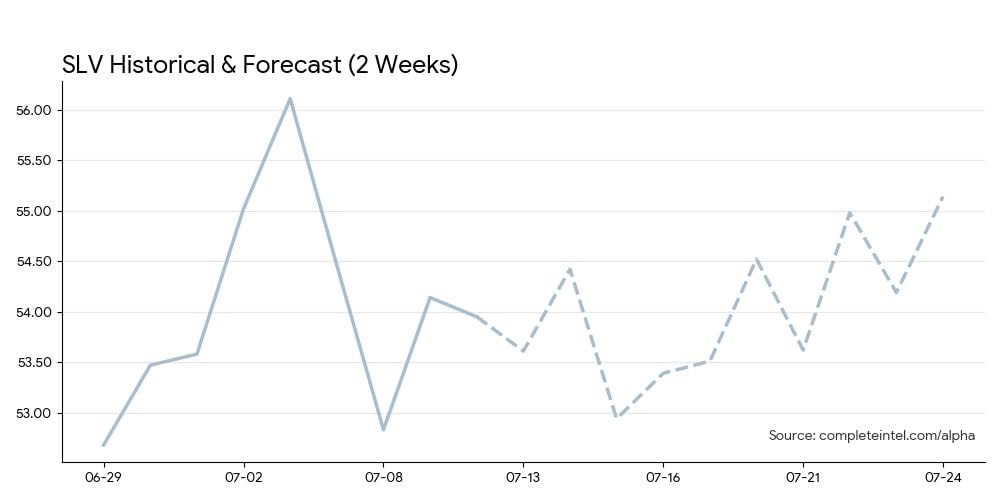
    Precious metals are a classic barometer for market fear and geopolitical stress. Even with treasury yields rising and equity markets rotating out of tech, the forecast for Silver indicates a sideways to slightly downward drift. CI Markets projects SLV to hover primarily in a range this week. This provides an excellent counterweight to the bond market. It suggests a lack of broad market panic, indicating that investors are actively rotating capital rather than hiding in traditional safe haven assets.

    SLV Chart

    Conclusion

    The signal for the week of July 13 is a measured recalibration. The market is digesting higher long term yields without resorting to panic selling. This environment allows housing finance names like FNMA to build a floor and recover, while safe haven assets like Silver drift sideways.

    The Wildcard: Keep a close watch on upcoming Q2 corporate earnings reports, as forward guidance will heavily influence the durability of this sector rotation.

    The content presented in this note is for informational purposes only and should not be construed as investment, financial, or trading advice. This analysis is generated from the output of Complete Intelligence’s proprietary artificial intelligence platform and does not constitute a personal recommendation. You should not base any investment decision solely on this material. Please consult with a qualified financial professional before making any investment decisions. Complete Intelligence is not liable for any actions taken based on information provided herein.

  • Week of July 6, 2026 – CI Markets Weekly Outlook

    CI Markets — Weekly Outlook

    Week of July 6, 2026 – CI Markets Weekly Outlook

    Complete Intelligence · Published July 05, 2026

    Entering the third quarter, the market is digesting a mixed bag of economic signals. We have just passed the July 4th holiday weekend, marking a shift in trading volumes and a pivot toward upcoming Q2 earnings reports. Over the weekend, the Japanese Yen breached critical support levels, putting significant focus on Japanese markets and global currency dynamics.

    Based on this macro environment, CI Markets is tracking a clear macroeconomic reaction. We are watching a steady rise in the US Dollar, a corresponding rally in Japanese equities, and a healthy consolidation in the US tech sector.


    The Currency Driver

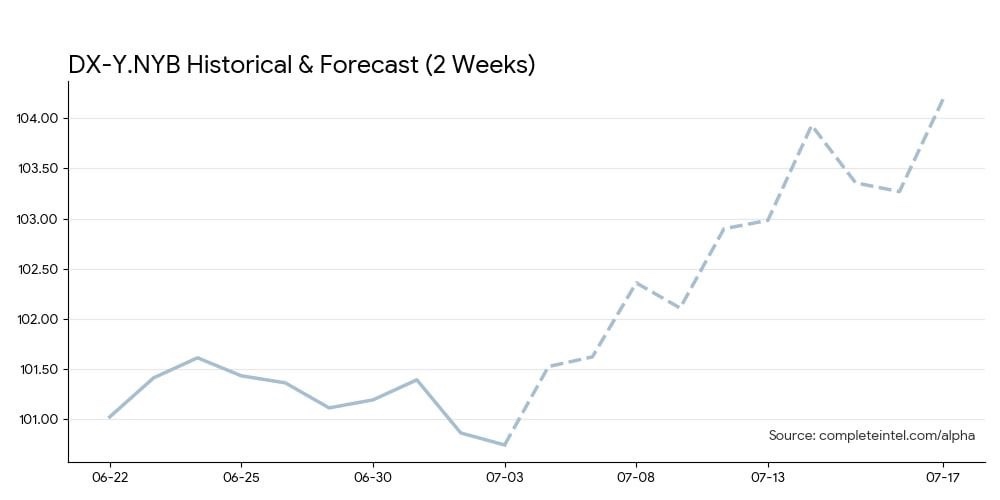
    The US Dollar is establishing steady strength, but the underlying driver is a structural liquidity squeeze rather than passive inflation metrics. The main catalyst is the supply restriction outlined by the Fed. Plans to trim the central bank balance sheet are actively removing dollars from global circulation, creating an organic shortage of greenbacks. This supply drop is matched by a strong global demand pull. Europe’s escalating trade dispute with China is shifting capital away from the Eurozone, while the structural depreciation of the Yen keeps the Dollar heavily favored. Furthermore, the clear display of US policy leverage following the G7 summit continues to anchor international capital firmly in dollar assets.

    DX-Y.NYB Chart

    Japanese Equities Respond

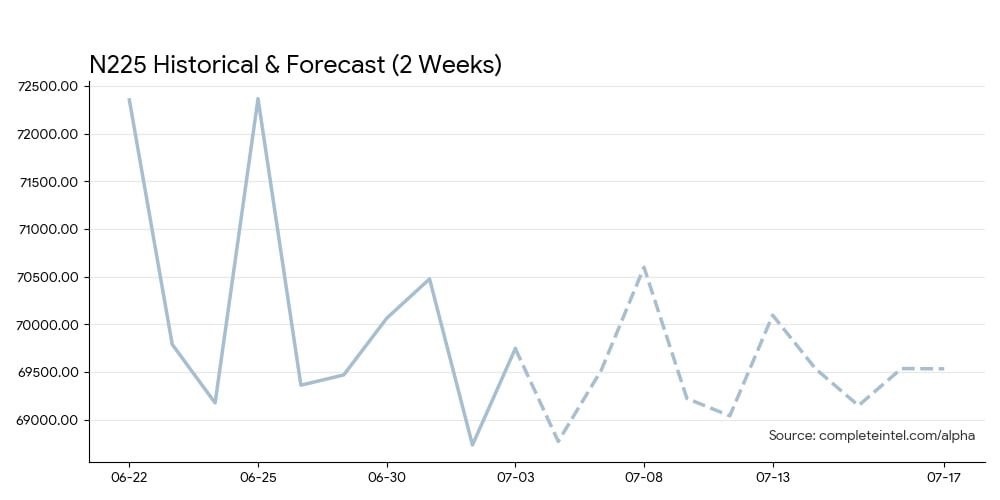
    The weekend news regarding the Japanese Yen breaching important psychological levels serves as a major macroeconomic anchor. A weaker Yen traditionally makes Japanese exports more competitive, providing a steady tailwind for their major indices. The CI Markets forecast for the Nikkei 225 shows a distinct rally to open the week, pushing up toward the 70,500 level by Wednesday before cooling off. This move perfectly illustrates how the equity market is directly reacting to the latest currency shifts.

    ^N225 Chart

    Tech Sector Consolidation

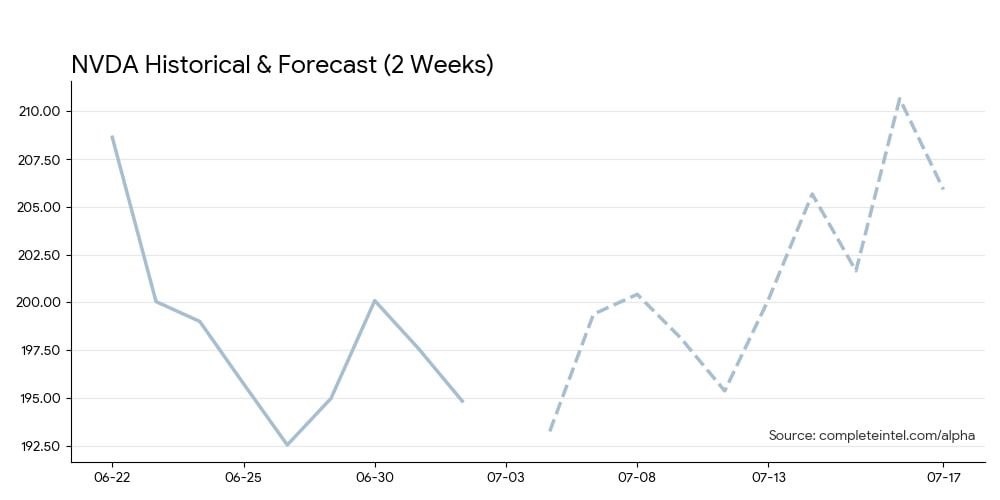
    Mega cap tech stocks carried the broader market through the first half of the year. As we enter a new quarter, investors are deciding whether to lock in gains or maintain their exposure. NVDA provides an excellent example of a sober tech sector rotation. The forecast points to a consolidation period, projecting the stock to hover in the mid to upper 190s after struggling to break firmly past the 200 mark. This indicates that capital is taking a breather and rotating to other sectors rather than chasing previous momentum.

    NVDA Chart

    Conclusion

    The signal for the week of July 6 is currency driven rotation. Persistent US Dollar strength is weighing on the Yen, which in turn supports a rally in the Nikkei 225. Meanwhile, US mega cap tech names like NVDA are entering a period of consolidation as investors evaluate Q3 positioning.

    The Wildcard: Keep a close watch on any unexpected interventions by the Bank of Japan, as this could rapidly reverse the current currency trends.

    The content presented in this note is for informational purposes only and should not be construed as investment, financial, or trading advice. This analysis is generated from the output of Complete Intelligence’s proprietary artificial intelligence platform and does not constitute a personal recommendation. You should not base any investment decision solely on this material. Please consult with a qualified financial professional before making any investment decisions. Complete Intelligence is not liable for any actions taken based on information provided herein.

  • Week of June 22, 2026 – CI Markets Weekly Outlook

    CI Markets — Weekly Outlook

    Week of June 22, 2026 — CI Markets Weekly Outlook

    Complete Intelligence · Published June 22, 2026

    Global markets are moving through a significant macroeconomic realignment. While headlines remain fixated on the ongoing rotation within the tech sector, deeper structural forces are actively reshaping the flow of capital. The primary driver of this transition is a strengthening US Dollar. This move is fueled by Federal Reserve policy adjustments, most notably indications of balance sheet trimming, alongside escalating trade frictions between Europe and China, and projected US policy strength following the G7 summit.
    Meanwhile, international markets are moving independently of US indices. The Bank of Japan’s recent, highly anticipated rate hike was met with a weak response. This outcome has cemented expectations for a persistently soft yen and altered the outlook for Japanese equities. In the energy sector, weekend developments regarding Iran peace negotiations are overriding localized geopolitical noise in the Strait of Hormuz, leading to a downward adjustment for crude.
    CI Markets signals a week defined by capital reallocation and currency dynamics, where a rising Dollar reshapes commodities and a weak yen supports export-driven growth in Japan.


    The Dollar’s Growth 🔼

    DX-Y.NYB

    The US Dollar is establishing steady strength over the currency markets. CI Markets forecasts the US Dollar Index (DX-Y.NYB) to open the week higher and sustain a persistent upward trajectory. This strength is not simply a byproduct of an equity rotation, but a direct reflection of tightening liquidity. The Fed’s signaling of balance sheet reductions is actively pulling dollars out of circulation. When combined with a depreciating yen, European trade anxieties, and projected US policy strength post-G7, the Dollar is operating as a clear anchor for global capital. This rising greenback will act as a structural headwind for global commodities and multinational earnings.

    DX-Y.NYB Chart

    Nikkei’s Export-Driven Growth 🔼

    ^N225

    While US equities wrestle with policy uncertainty, Japanese markets are poised for a steady upward move. CI Markets projects an upward rise for the Nikkei 225 to open the week, followed by a sustained climb. This move is deeply rooted in the Bank of Japan’s perceived weakness. Despite a recent 25 basis point hike, the lack of market response has cemented expectations that the yen will remain soft. This dynamic creates a tailwind for Japanese corporations, making their exports competitive against Chinese and Korean alternatives, while global consumers continue to prioritize the reliability of Japanese products.

    ^N225 Chart

    Brent Crude’s Continued Downward Drift 🔽

    BZ=F

    The energy market is undergoing a clear recalibration. Despite recent noise regarding events in the Strait of Hormuz over the weekend, the CI Markets forecast projects a continued drop in Brent Crude (BZ=F) to open the week, followed by ongoing downward pressure. The market is looking past localized skirmishes and pricing in two bearish realities. The successful advancement of Iran peace negotiations is actively lowering the geopolitical risk premium. Simultaneously, the rising US Dollar is suppressing global commodity demand.

    BZ=F Chart

    Conclusion

    The signal for the week of June 22 is Macroeconomic Reallocation. Investors must look beyond domestic equity rotations and focus on the power of the currency markets. An ascendant US Dollar will dictate commodity pricing, while a soft yen provides a structural advantage to Japanese equities.

    The Wildcard: Keep a close watch on Chinese export data and trade rhetoric. As Japan’s export competitiveness rises on the back of a weak yen, Beijing may be forced to respond economically, potentially impacting regional currency stability.

    The content presented in this note is for informational purposes only and should not be construed as investment, financial, or trading advice. This analysis is generated from the output of Complete Intelligence’s proprietary artificial intelligence platform and does not constitute a personal recommendation. You should not base any investment decision solely on this material. Please consult with a qualified financial professional before making any investment decisions. Complete Intelligence is not liable for any actions taken based on information provided herein.

  • Week of June 15, 2026 – CI Markets Weekly Outlook

    CI Markets — Weekly Outlook

    Week of June 15, 2026 – CI Markets Weekly Outlook

    Complete Intelligence · Published June 15, 2026


    The market is undergoing a profound transition, signaling a structural shift beyond the initial AI hype cycle. Last week, the broader technology sector faced a severe reality check, heavily pressured by rising AI skepticism and a disappointing earnings report from Broadcom. However, this dynamic does not represent a wholesale abandonment of equities. Rather, it marks a rapid rotation away from speculative growth and toward tangible value and industrial quality. Adding a layer of complex regulatory overhang, President Trump has summoned top AI executives to the White House next week. This impending summit introduces significant policy uncertainty into the tech space, further accelerating the flight toward legacy incumbents and traditional industrial sectors. Meanwhile, the highly anticipated SpaceX IPO continues to draw capital and attention, highlighting the market’s appetite for tangible, frontier hardware over unproven software concepts. Simultaneously, weekend geopolitical developments surrounding Iran peace negotiations are forcing a rapid repricing in energy markets. CI Markets signals a week of intense strategic repositioning, where investors prioritize foundational industrials, legacy tech quality, and recalibrated commodity risk.


    The Industrial Rotation Takes Hold: Industrial Select Sector SPDR Fund (XLI)

    As capital rotates out of high-flying tech names, it is actively searching for grounded value, and the Industrial sector is catching the bid. After a brief recalibration to open the week, CI Markets forecasts the Industrial Select Sector (XLI) to build steady, day-over-day upward momentum, actively breaking higher as the rotation matures. This indicates that institutional capital is not just fleeing speculative growth, but is structurally reallocating into foundational, “real economy” sectors. Investors should view this upward trajectory as a signal that the rotation toward quality is finding solid footing.

    XLI Chart


    The Legacy Tech Resurgence: Intel Corporation (INTC)

    Amidst the broader tech sector turbulence and mounting regulatory fears, legacy incumbents are catching a significant bid. CI Markets forecasts Intel (INTC) to experience a sharp downward adjustment on Monday, followed immediately by a powerful, sustained upward rally throughout the week. As institutional capital abandons highly speculative, unproven AI plays, it is actively seeking the safety of established blue chips with proven manufacturing capabilities and deep structural moats. INTC’s forecasted strength highlights a clear “flight to quality” within the semiconductor space itself.

    INTC Chart


    The Geopolitical Repricing: Crude Oil (CL=F)

    Over the weekend, headlines regarding renewed Iran peace negotiations introduced the possibility of an easing geopolitical risk premium. CI Markets forecast data for Crude Oil (CL=F) perfectly captures this breaking narrative. The model shows an immediate, steep downward adjustment early in the week—reflecting the market aggressively stripping out the geopolitical premium—before finding a lower floor and establishing choppy consolidation. This provides a clear, data-driven signal that energy markets are rapidly recalibrating to the weekend’s diplomatic developments.

    Crude Oil Chart


    Conclusion

    The signal for the week of June 15 is a Structural Repositioning. The market is actively punishing speculative tech while rewarding legacy incumbents (INTC) and industrial quality (XLI), while adjusting to shifting geopolitical realities (CL=F). The Wildcard: Keep a close watch on the headlines emerging from the White House AI summit. Any indication of broadening, stringent regulatory frameworks or additional export controls could severely amplify the tech sector’s bifurcation, heavily favoring established hardware manufacturers over software and service challengers.

    The content presented in this note is for informational purposes only and should not be construed as investment, financial, or trading advice. This analysis is generated from the output of Complete Intelligence’s proprietary artificial intelligence platform and does not constitute a personal recommendation. You should not base any investment decision solely on this material. Please consult with a qualified financial professional before making any investment decisions. Complete Intelligence is not liable for any actions taken based on information provided herein.

  • Week of June 1, 2026 — CI Markets Weekly Outlook

    CI Markets — Weekly Outlook

    Week of June 1, 2026 — CI Markets Weekly Outlook

    Complete Intelligence · Published May 30, 2026

    The market is bracing for a high-stakes week as two massive, competing narratives collide.

    On one front, the technology sector is hyper-focused on Taiwan, where the CEOs of the world’s most powerful semiconductor companies are gathering for Computex. The anticipation surrounding next-generation AI architectures is reaching a fever pitch, driving intense speculative flows. However, acting as a heavy counterweight is the bond market. Treasury yields are signaling severe macroeconomic headwinds, driven by hotter-than-expected inflation metrics that are testing the Federal Reserve’s policy outlook.

    CI Markets signals a week of extreme cross-currents, where the irresistible force of the AI super-cycle meets the immovable object of rising interest rates.


    The Outlier Event: Advanced Micro Devices (AMD)

    The focal point of the week is the Computex conference, and CI Markets is projecting a historic, near-vertical surge for Advanced Micro Devices (AMD). It is important to caveat that a forecast of this magnitude is an extreme outlier. For this data to materialize, AMD’s presentation cannot merely be “good.” CEO Lisa Su must deliver an absolute game-changer. The market is aggressively positioning for a product reveal (likely next-generation Instinct AI accelerators or Zen CPUs) that definitively proves AMD is capturing significant market share from its dominant rival.

    AMD Chart

    The Incumbent’s Volatility: NVIDIA (NVDA)

    In stark contrast to AMD’s projected surge, the forecast for NVIDIA (NVDA) indicates significant uncertainty. CI Markets forecasts a choppy, volatile week for the AI incumbent. The data suggests an initial pullback, followed by a mid-week rebound, ultimately failing to break new ground. This turbulence reflects investors selectively locking in profits and bracing for impact as competitors attempt to challenge NVIDIA’s moat in Taiwan. The volatility perfectly illustrates the high-stakes nature of this week’s semiconductor showdown.

    NVDA Chart

    The Macro Reality Check: 5-Year Treasury Yield (^FVX)

    While tech investors are consumed by the AI battle in Taiwan, the bond market is quietly signaling distress. CI Markets forecasts the 5-Year Treasury Yield (^FVX) to experience a persistent upward spike throughout the week. This movement implies that stubborn inflation data is cementing itself into the yield curve. The rising cost of capital acts as a stark macro reality check, effectively neutralizing hopes for near-term Federal Reserve rate cuts and creating a heavy structural ceiling for the broader equities market.

    ^FVX Chart

    Conclusion

    The signal for the week of June 1 is a Computex Showdown. Market direction will hinge entirely on whether the physical realities of the semiconductor supply chain can outweigh the mathematical realities of the bond market.

    The Wildcard: Keep a close watch on the immediate institutional reaction to AMD’s presentation. If the market deems the announcements underwhelming relative to the massive speculative buildup, the resulting tech selloff could be severe, especially with rising yields compounding the pressure.

    The content presented in this note is for informational purposes only and should not be construed as investment, financial, or trading advice. This analysis is generated from the output of Complete Intelligence’s proprietary artificial intelligence platform and does not constitute a personal recommendation. You should not base any investment decision solely on this material. Please consult with a qualified financial professional before making any investment decisions. Complete Intelligence is not liable for any actions taken based on information provided herein.

  • Weekly Outlook: May 4, 2026

    CI Markets — Weekly Outlook

    Weekly Outlook: May 4, 2026

    Complete Intelligence · Published May 04, 2026


    The global market is currently locked in a powerful tug-of-war between “higher-for-longer” interest rates and a massive wave of Big Tech earnings. With the lack of a diplomatic off-ramp in the Middle East, the “War-Inflation” narrative has cemented itself into the data. The Federal Reserve’s recent meeting highlighted internal dissent and a stark lack of confidence in near-term rate cuts. As a result, the bond market is aggressively steepening the yield curve, effectively “testing Washington.” However, instead of panicking into cash, institutional capital is executing a massive rotation—fleeing the long end of the Treasury curve and hiding in the cash-rich, secular growth engines of the tech sector, while traditional safe-havens struggle to find their footing. CI Markets signals a week of intense macro divergence, where sovereign-level corporate balance sheets are effectively decoupling from geopolitical gravity.


    The Yield Shock Casualty Forecast

    iShares 20+ Year Treasury Bond ETF (TLT) Trend Down 🔽 With the Fed signaling an inability to cut rates amid sticky, conflict-driven inflation, the bond market is demanding higher compensation. CI Markets forecasts TLT to resume its downward trajectory this week. The lack of a ceasefire is maintaining a structurally high floor for energy costs, keeping the Federal Reserve trapped. As the market digests this reality, capital is taking flight from the long end of the Treasury curve, leading to continued price discovery and volatility for long-duration bonds.


    The Sovereign Balance Sheet Forecast

    Apple Inc. (AAPL) Trend Up 🔼 Despite the macroeconomic headwinds and rising yields that typically punish equities, top-tier tech is catching a massive structural bid. CI Markets forecasts AAPL to trend higher and stabilize this week. Fueled by resilient iPhone sales in China and a historic $100 billion share buyback announcement, Apple is acting as a “Sovereign Balance Sheet.” Institutional investors are treating the cash-rich mega-cap as an ultimate safe-haven, entirely insulating their capital from the broader geopolitical and interest rate noise.


    The Rate-Trapped Safe Haven Forecast

    Gold (GC=F) Trend Down 🔽 In a fascinating macro divergence, CI Markets forecasts GC=F to trend lower this week. Typically, an ongoing geopolitical crisis would trigger a massive rally in gold. However, the resulting “sticky inflation” has steepened the yield curve and strengthened the dollar, creating a massive headwind for non-yielding assets. The market is showing a “struggle for directional conviction,” but the math of higher-for-longer Treasury yields is currently outweighing the geopolitical fear premium for the precious metal.


    Conclusion

    The signal for the week of May 4 is Macro Divergence. The broader economy is wrestling with the reality of an extended conflict and high borrowing costs, but the top end of the equity market is playing by its own rules. The Wildcard: Watch the Treasury auctions this week. If demand is exceptionally weak, it could cause a sudden, violent spike in the 10-year yield, which may finally be enough to crack the armor of the mega-cap tech rally.

    The content presented in this note is for informational purposes only and should not be construed as investment, financial, or trading advice. This analysis is generated from the output of Complete Intelligence’s proprietary artificial intelligence platform and does not constitute a personal recommendation. You should not base any investment decision solely on this material. Please consult with a qualified financial professional before making any investment decisions. Complete Intelligence is not liable for any actions taken based on information provided herein.

  • Weekly Outlook: April 27, 2026

    .nl-wrap { font-family: ‘Montserrat’, -apple-system, BlinkMacSystemFont, ‘Segoe UI’, Roboto, sans-serif; max-width: 680px; margin: 0 auto; padding: 0 20px 40px 20px; color: #222; line-height: 1.8; }
    .nl-wrap .nl-topbar { background: #0066cc; color: #fff; text-align: center; padding: 10px 0; margin: 0 -20px 32px -20px; font-size: 12px; text-transform: uppercase; letter-spacing: 2px; font-weight: 600; }
    .nl-wrap .nl-title { margin-bottom: 28px; }
    .nl-wrap .nl-title h1 { font-size: 30px; font-weight: 700; color: #111; margin: 0 0 6px 0; line-height: 1.2; }
    .nl-wrap .nl-title .nl-meta { font-size: 13px; color: #888; }
    .nl-wrap .nl-divider { border: none; border-top: 1px solid #e0e0e0; margin: 28px 0; }
    .nl-wrap .nl-intro { font-size: 17px; margin-bottom: 8px; }
    .nl-wrap .nl-intro p { margin: 0; }
    .nl-wrap .nl-forecast { margin-bottom: 8px; }
    .nl-wrap .nl-forecast h2 { font-size: 17px; font-weight: 700; color: #0066cc; margin: 0 0 8px 0; display: flex; align-items: center; gap: 8px; }
    .nl-wrap .nl-trend { display: inline-flex; align-items: center; justify-content: center; width: 28px; height: 28px; border-radius: 50%; font-size: 14px; flex-shrink: 0; }
    .nl-wrap .nl-trend.up { background: #e6f4ea; color: #1e7e34; }
    .nl-wrap .nl-trend.down { background: #fce8e6; color: #c62828; }
    .nl-wrap .nl-forecast p { font-size: 16px; margin: 0; }
    .nl-wrap .nl-conclusion h2 { font-size: 17px; font-weight: 700; color: #111; margin: 0 0 8px 0; }
    .nl-wrap .nl-conclusion p { font-size: 16px; margin: 0; }
    .nl-wrap .nl-promo-banner { background: linear-gradient(135deg, #fef3c7 0%, #fde68a 100%); border: 2px solid #f59e0b; border-radius: 8px; padding: 24px; text-align: center; margin: 32px 0; }
    .nl-wrap .nl-promo-banner h3 { font-size: 18px; font-weight: 700; color: #92400e; margin: 0 0 8px 0; }
    .nl-wrap .nl-promo-banner .nl-promo-code { font-size: 20px; font-weight: 700; color: #dc2626; background: #fff; padding: 8px 20px; border-radius: 4px; display: inline-block; margin: 12px 0; letter-spacing: 1px; }
    .nl-wrap .nl-promo-banner p { font-size: 14px; color: #78350f; margin: 8px 0 0 0; }
    .nl-wrap .nl-cta { text-align: center; margin: 32px 0 0 0; padding: 20px 0; }
    .nl-wrap .nl-cta a.nl-btn-free { background: #16a34a; color: #fff; padding: 12px 32px; border-radius: 4px; text-decoration: none; font-size: 14px; font-weight: 600; display: inline-block; margin: 0 6px 10px 6px; }
    .nl-wrap .nl-cta a.nl-btn-premium { background: #0066cc; color: #fff; padding: 12px 32px; border-radius: 4px; text-decoration: none; font-size: 14px; font-weight: 600; display: inline-block; margin: 0 6px 10px 6px; }
    .nl-wrap .nl-cta .nl-cta-note { font-size: 13px; color: #888; margin-top: 10px; }
    .nl-wrap .nl-disclaimer { margin-top: 40px; padding-top: 16px; border-top: 1px solid #e0e0e0; font-size: 11px; color: #aaa; line-height: 1.5; }

    CI Markets — Weekly Outlook

    Weekly Outlook: April 27, 2026

    Complete Intelligence · Published April 27, 2026


    The diplomatic off-ramp has vanished, and the global market is violently repricing a return to “Kinetic Reality.” Hopes for a swift resolution in the Middle East collapsed over the weekend following the abrupt cancellation of the US administration’s trip to Pakistan and the immediate departure of the Iranian delegation. The sudden breakdown of these peace talks means the market can no longer price in a convenient diplomatic ceiling to the current crisis. We are now likely facing a more intense conflict, which instantly reignites fears of longer term, supply-driven inflation and forces institutional capital into a posture of strategic hardening. CI Markets signals a week of high-stakes macro rotation. Capital is transitioning from vulnerable cyclical trades and rotating into sovereign infrastructure and yield compensation, creating a fascinating divergence across traditional sectors.


    The War-Inflation Premium Forecast: 10-Year Treasury Yield (^TNX) Trend Up

    With the collapse of the peace talks, the “War-Inflation” loop has returned. The market is instantly realizing that an extended conflict in the Middle East will keep energy input costs structurally elevated, effectively trapping the Federal Reserve and making rate cuts very complicated. CI Markets forecasts ^TNX to trend aggressively higher this week. The “Instability Premium” is back, and bond buyers are likely to demand higher yields to compensate for the reality of persistent, conflict-driven inflation.

    CI Markets Alpha Forecast Chart

    The Sovereign Tech Haven Forecast: VanEck Semiconductor ETF (SMH) Trend Up

    As geopolitical risk reignites and global supply lines appear increasingly fragile, capital is seeking out assets that can entirely decouple from the Middle East chaos. CI Markets forecasts the semiconductor infrastructure basket, SMH, to gap up and trend notably higher this week. While broader equities wrestle with the specter of war, foundational tech manufacturing is catching a massive flight-to-quality bid. Investors are treating domestic and allied compute capacity as the ultimate sovereign safe haven, prioritizing physical technological infrastructure over all other growth assets.

    CI Markets Alpha Forecast Chart

    The Equity Disconnect Forecast: Energy Select Sector (XLE) Trend Down

    In one of the most revealing contrarian signals of the week, the energy equity basket is completely decoupling from the raw commodity narrative. Despite the collapse of peace talks, which theoretically boosts crude tension, our forecast shows XLE trending lower. This highlights a critical pivot in market psychology: equity investors are actively taking profits and derisking. The calculation is shifting toward “demand destruction.” A more intense war, combined with higher treasury yields, may eventually force a broader economic slowdown that outweighs the short-term profitability of the energy sector. Conclusion The signal for the week of April 27 is Kinetic Reality. The market has abandoned the euphoria of a quick ceasefire and is preparing for a long, inflationary grind. The Wildcard: Watch for the immediate physical fallout in the Strait of Hormuz. Any retaliatory actions targeting the ongoing mine cleanup operations could spark a severe panic in the broader indices, forcing yields even higher as the inflation floor hardens.

    CI Markets Alpha Forecast Chart

    Conclusion

    Conclusion The signal for the week of April 27 is Kinetic Reality. The market has abandoned the euphoria of a quick ceasefire and is preparing for a long, inflationary grind. The Wildcard: Watch for the immediate physical fallout in the Strait of Hormuz. Any retaliatory actions targeting ongoing mine cleanup operations could spark a severe panic in broader indices, forcing yields even higher as the inflation floor hardens.

    🎉 Limited Time Offer: Get Premium for 99¢

    Unlock full US S&P 500 stocks, ETFs, and daily-interval forecasts with CI Markets Premium

    TAXRELIEF

    Use code TAXRELIEF at checkout for 99¢ first 2 months

    The content presented in this note is for informational purposes only and should not be construed as investment, financial, or trading advice. This analysis is generated from the output of Complete Intelligence’s proprietary artificial intelligence platform and does not constitute a personal recommendation. You should not base any investment decision solely on this material. Please consult with a qualified financial professional before making any investment decisions. Complete Intelligence is not liable for any actions taken based on information provided herein.
  • Weekly Outlook: April 20, 2026

    CI Markets — Weekly Outlook

    Weekly Outlook: April 20, 2026

    Complete Intelligence · Published April 20, 2026


    The global market is navigating a state of “uncomfortable peace” as we enter the third week of April. While the US-Iran ceasefire has technically held, the weekend reports of attacks on Indian vessels attempting to exit the Strait of Hormuz have abruptly halted the “euphoria trade” seen last week. The mine cleanup operations continue, but the weekend’s events serve as a violent reminder that the map is still hot. This geopolitical fragility is colliding with a domestic reality where “Sticky Inflation” remains a dominant floor, following the record CPI data that revealed a permanent upward shift in input costs. CI Markets signals a week of Selective Hardening. Capital is moving away from the speculative “Ceasefire Relief” and toward assets with physical, strategic resilience. We are watching for a divergence between the “Digital Growth” that led the previous cycle and the “Physical Foundations” that will define this one.


    The Geopolitical Floor Forecast: Brent Crude (BZ=F) Trend Neutral/Up

    The energy complex is caught between a diplomatic desire for lower prices and the physical reality of a restricted Strait. While we expect the “War Premium” to continue finding a baseline if diplomacy holds through Monday, the weekend’s targeting of vessels has re-injected a significant floor into the tape. CI Markets forecasts BZ=F to open with a significant risk-premium gap compared to Friday’s close. We are maintaining a cautious upward bias, acknowledging that while the trend may seek “discovery” throughout the week, the floor for energy remains structurally higher until the Strait is fully secured and neutral trade is guaranteed.


    The Strategic Infrastructure Bid Forecast: Taiwan Semiconductor (TSM) Trend Up

    The semiconductor narrative is evolving from a story of “AI Design” into one of “Physical Capacity.” As compute infrastructure is increasingly treated as a national security asset, capital is rotating into the foundries that own the means of production. CI Markets forecasts TSM to trend higher this week. Despite broader tech volatility and the valuation squeeze in high-multiple designers, the market is treating TSM as a sovereign anchor. It represents the “First In” trade for institutional capital seeking exposure to the “Strategic Hardening” of the global supply chain.


    The Consumer Squeeze Casualty Forecast: Las Vegas Sands (LVS) Trend Down

    While the industrial and energy sectors find a floor, the high-beta consumer discretionary space is facing a violent reality check. The combination of “Sticky Inflation” and persistent energy costs is finally beginning to squeeze the global consumer wallet. CI Markets forecasts LVS to move lower this week. As the “Record CPI” print becomes a permanent part of the macro backdrop, investors are fleeing high-valuation travel and leisure names in favor of defensive staples. The sector represents the primary casualty of a world where “Physical Reality” has replaced “Excess Liquidity.”


    Conclusion

    The signal for the week of April 20 is Fragile Normalization. The market is opening in a “defensive crouch,” waiting to see if the weekend’s Hormuz noise escalates or resolves. The Wildcard: Watch for a breakthrough in the Indian-led maritime security talks or a midweek announcement regarding an emergency SPR release. Any move to physically secure the Strait could spark a sharp relief rally in the consumer and tech sectors, but the underlying inflation floor is likely to keep the “Defensive Rotation” in play.

    The content presented in this note is for informational purposes only and should not be construed as investment, financial, or trading advice. This analysis is generated from the output of Complete Intelligence’s proprietary artificial intelligence platform and does not constitute a personal recommendation. You should not base any investment decision solely on this material. Please consult with a qualified financial professional before making any investment decisions. Complete Intelligence is not liable for any actions taken based on information provided herein.
  • Weekly Outlook: March 2, 2026

    CI Markets — Weekly Outlook

    Weekly Outlook: March 2, 2026

    Complete Intelligence · Published March 02, 2026

    The “Tariff Wall” has been overshadowed by the “Geopolitical Shock.” Going into Friday’s close, the market was hyper-focused on retail lawsuits and a strengthening US Dollar. However, the sudden escalation of the Iran conflict over the weekend has radically altered the board. The global carry trade is facing another stress test, and the market is opening this week in a purely defensive, “shoot-first” posture. In moments of sudden geopolitical rupture, capital does not wait for the Fed or the courts; it seeks immediate refuge in tangibility. CI Markets signals a massive, volume-heavy rotation this week into the “Chaos Hedges”—specifically precious metals, energy security, and the highest-conviction sovereign tech infrastructure. ↓


    The Sovereign Compute Bid

    Forecast: NVIDIA (NVDA) Trend Up 🔼 In a geopolitical crisis, most high-beta tech sells off. Nvidia is the exception. As the conflict in the Middle East escalates, the narrative around “Sovereign AI” and domestic compute infrastructure hardens from a corporate luxury into a national security imperative. CI Markets forecasts NVDA to trend higher this week. The stock is officially decoupling from standard macro volatility; it is no longer just a “growth” play, but a strategic asset that capital is hiding in when global supply chains look vulnerable. ↓


    The Hyper-Kinetic Chaos Hedge

    Forecast: Silver (SLV) Bullish 🔼 While Gold gets the immediate headline bid, Silver is where the aggressive capital is rotating. The Iran conflict has sparked a flight to safety, but Silver offers the dual mandate of being a precious metal haven and a critical industrial input for the defense and tech sectors. CI Markets forecasts a violent upward trend for SLV this week. As fiat currencies face the inflationary pressure of another potential oil shock, Silver is presenting as the ultimate high-beta refuge. ↓


    The Energy Security Premium

    Forecast: Energy Select Sector (XLE) Moving Higher 🔼 The most direct transmission mechanism for the weekend’s news is the energy market. With the Middle East facing open conflict, the “geopolitical risk premium” on oil is expanding rapidly. CI Markets forecasts XLE to move higher this week. Domestic energy producers are catching a massive tailwind as they become the de facto buffer against global supply disruptions. For investors, this sector is transitioning from a “Value” rotation into a mandatory portfolio hedge. ↓


    Conclusion

    The signal for the week of March 2 is Geopolitical Hardening. The market has paused its domestic policy debates to price in the stark reality of the Iran conflict. The Wildcard: Watch for emergency rhetoric out of Washington regarding strategic petroleum reserves or expedited defense appropriations. Any move by the administration to aggressively guarantee domestic energy and compute supply could spark an even sharper rally in energy and semiconductor names. 

    Subscribe to CI Markets — $24.95/mo

    No contract. Cancel anytime.

    The content presented in this note is for informational purposes only and should not be construed as investment, financial, or trading advice. This analysis is generated from the output of Complete Intelligence’s proprietary artificial intelligence platform and does not constitute a personal recommendation. You should not base any investment decision solely on this material. Please consult with a qualified financial professional before making any investment decisions. Complete Intelligence is not liable for any actions taken based on information provided herein.
    CI Markets — Weekly Outlook

    Weekly Outlook: March 2, 2026

    Complete Intelligence · Published March 02, 2026


    The “Tariff Wall” has been overshadowed by the “Geopolitical Shock.” Going into Friday’s close, the market was hyper-focused on retail lawsuits and a strengthening US Dollar. However, the sudden escalation of the Iran conflict over the weekend has radically altered the board. The global carry trade is facing another stress test, and the market is opening this week in a purely defensive, “shoot-first” posture. In moments of sudden geopolitical rupture, capital does not wait for the Fed or the courts; it seeks immediate refuge in tangibility. CI Markets signals a massive, volume-heavy rotation this week into the “Chaos Hedges”—specifically precious metals, energy security, and the highest-conviction sovereign tech infrastructure. ↓


    The Sovereign Compute Bid

    Forecast: NVIDIA (NVDA) Trend Up 🔼 In a geopolitical crisis, most high-beta tech sells off. Nvidia is the exception. As the conflict in the Middle East escalates, the narrative around “Sovereign AI” and domestic compute infrastructure hardens from a corporate luxury into a national security imperative. CI Markets forecasts NVDA to trend higher this week. The stock is officially decoupling from standard macro volatility; it is no longer just a “growth” play, but a strategic asset that capital is hiding in when global supply chains look vulnerable. ↓


    The Hyper-Kinetic Chaos Hedge

    Forecast: Silver (SLV) Bullish 🔼 While Gold gets the immediate headline bid, Silver is where the aggressive capital is rotating. The Iran conflict has sparked a flight to safety, but Silver offers the dual mandate of being a precious metal haven and a critical industrial input for the defense and tech sectors. CI Markets forecasts a violent upward trend for SLV this week. As fiat currencies face the inflationary pressure of another potential oil shock, Silver is presenting as the ultimate high-beta refuge. ↓


    The Energy Security Premium

    Forecast: Energy Select Sector (XLE) Moving Higher 🔼 The most direct transmission mechanism for the weekend’s news is the energy market. With the Middle East facing open conflict, the “geopolitical risk premium” on oil is expanding rapidly. CI Markets forecasts XLE to move higher this week. Domestic energy producers are catching a massive tailwind as they become the de facto buffer against global supply disruptions. For investors, this sector is transitioning from a “Value” rotation into a mandatory portfolio hedge. ↓


    Conclusion

    The signal for the week of March 2 is Geopolitical Hardening. The market has paused its domestic policy debates to price in the stark reality of the Iran conflict. The Wildcard: Watch for emergency rhetoric out of Washington regarding strategic petroleum reserves or expedited defense appropriations. Any move by the administration to aggressively guarantee domestic energy and compute supply could spark an even sharper rally in energy and semiconductor names.

    Subscribe to CI Markets PREMIUM— $24.95/mo

    No contract. Cancel anytime.

    The content presented in this note is for informational purposes only and should not be construed as investment, financial, or trading advice. This analysis is generated from the output of Complete Intelligence’s proprietary artificial intelligence platform and does not constitute a personal recommendation. You should not base any investment decision solely on this material. Please consult with a qualified financial professional before making any investment decisions. Complete Intelligence is not liable for any actions taken based on information provided herein.
  • Weekly Outlook: Feb 23, 2026

    Weekly Outlook: Feb 23, 2026

    The “Anti-Inflation” narrative has just met the “Protectionist Wall.”


    Friday’s tariff decisions were a blunt instrument, but the retail sector is not taking them lying down. The news that a group of the nation’s largest importers is suing the US government for relief has fundamentally changed the calculus for the week. While the Dow 50,000 milestone from two weeks ago gave us a psychological floor, the “Tariff Litigation” era is introducing a high-stakes legal binary to the market.


    Capital is now moving toward assets that serve as proxies for the “Cost of Policy.” CI Markets signals a pivot into the beneficiaries of the strengthening Dollar, the “Survivor” retailers, and the repricing of the yield curve under an inflationary regime.

    1. The Retail Litigation Proxy Forecast: Target (TGT) Trend Up 🔼

    All eyes turn to Target as the representative for the retail sector this week. As a major importer, Target is in the crosshairs of the tariff fight, but the market is already pricing in a “survival of the fittest” outcome. CI Markets forecasts TGT to trend higher this week. The sentiment is clear: if the retail coalition wins its lawsuit, the relief rally could be significant; if it loses, the market expects Target’s scale to allow it to outmaneuver smaller competitors through supply chain agility.

    2. The Strengthening Tariff Wall Forecast: US Dollar Index (DXY) Bullish 🔼

    Tariffs are historically a Dollar-bullish event, and this time is no different. As barriers go up, the greenback is finding a renewed bid from investors hedging against a more isolated, higher-cost domestic economy. CI Markets forecasts the DXY to move higher this week. Despite the domestic unrest seen over the weekend, the “Tariff Premium” is currently outweighing social risk in the currency markets.

    3. The Inflationary Yield Squeeze 🔽

    The market is connecting the dots between tariffs and sticky inflation. As importers warn of price hikes, the bond market is pre-emptively repricing for a less-dovish Fed. CI Markets forecasts TLT to trend lower (meaning yields are moving higher) this week. With the 10-year yield finding a floor, the “Yield Search” we tracked earlier is turning into a flight to shorter duration and the safety of the strengthening Dollar.

    Conclusion

    The signal for the week of February 23 is Litigation Volatility. The market has moved beyond the “Warsh Pivot” and into a direct confrontation between the private sector and the administration’s trade policy.


    The content presented in this note is for informational purposes only and should not be construed as investment, financial, or trading advice. This analysis is generated from the output of Complete Intelligence’s proprietary artificial intelligence platform and does not constitute a personal recommendation. You should not base any investment decision solely on this material. Please consult with a qualified financial professional before making any investment decisions. Complete Intelligence is not liable for any actions taken based on the information provided herein.