
Week of July 13, 2026: CI Markets Weekly Outlook
As we navigate the heart of the summer trading session, the Q2 earnings season is fully underway. The broader market continues to recalibrate to resilient economic data and shifting central bank timelines. With technology stocks taking a necessary breather, capital flows are revealing an interesting dynamic between interest rates, domestic housing finance, and traditional safe haven assets. Based on this macro environment, CI Markets is tracking a clear upward push in long term yields, a localized recovery in housing finance, and a muted response from precious metals.
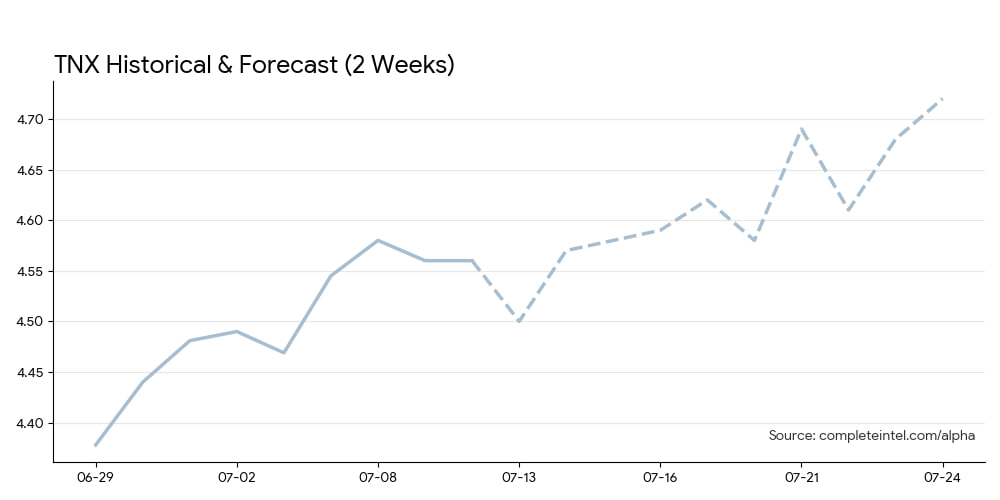
▲ Forecast: 10-Year Treasury Yield (^TNX) Trend Up 🔼
The bond market continues to search for equilibrium. After a brief period of consolidation in early July, investors are once again adjusting to the reality of sticky economic metrics. CI Markets forecasts the 10-year yield to climb steadily this week. The model projects the yield rising from the mid 4.4% range up toward 4.6% by Friday. This upward trend clearly signals that the market is actively pricing in a prolonged period of elevated interest rates as we move deeper into Q3.
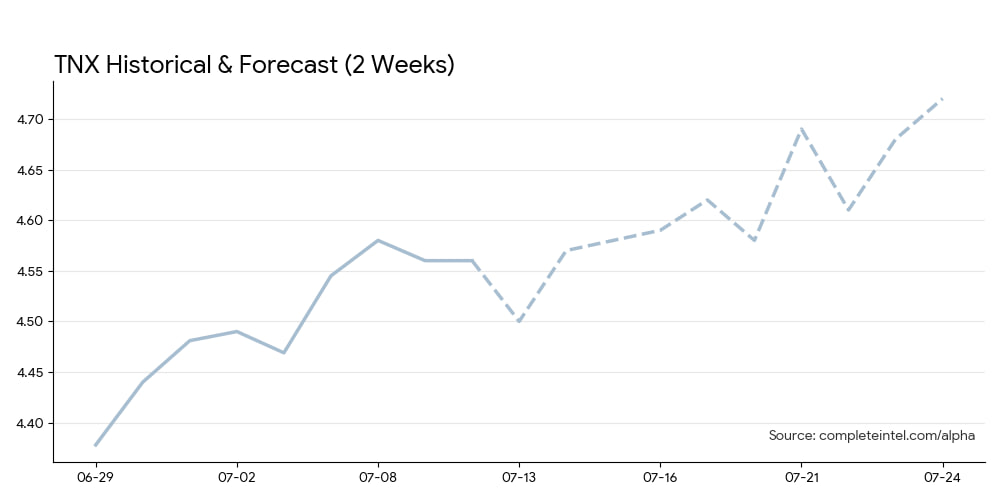
= Forecast: Fannie Mae (FNMA) Trend Sideways ⏸️
The mortgage market is highly sensitive to the 10-year yield. As the benchmark yield climbs, mortgage rates are pressured higher, creating immediate headwinds for housing finance. However, CI Markets forecasts Fannie Mae (FNMA) to weather this pressure. The model shows the stock attempting to build a solid floor early in the week before bouncing back by Friday. This suggests that despite the macro pressure of rising yields, specific domestic financial institutions are finding support.
= Forecast: iShares Silver Trust (SLV) Trend Sideways ⏸️
Precious metals are a classic barometer for market fear and geopolitical stress. Even with treasury yields rising and equity markets rotating out of tech, the forecast for Silver indicates a sideways to slightly downward drift. CI Markets projects SLV to hover primarily in a range this week. This provides an excellent counterweight to the bond market. It suggests a lack of broad market panic, indicating that investors are actively rotating capital rather than hiding in traditional safe haven assets.
Conclusion
The signal for the week of July 13 is a measured recalibration. The market is digesting higher long term yields without resorting to panic selling. This environment allows housing finance names like FNMA to build a floor and recover, while safe haven assets like Silver drift sideways.
The Wildcard: Keep a close watch on upcoming Q2 corporate earnings reports, as forward guidance will heavily influence the durability of this sector rotation.
Subscribe to CI Markets ALPHA
Subscribe to CI Markets PREMIUM — $24.95/mo
No contract. Cancel anytime.
The content presented in this note is for informational purposes only and should not be construed as investment, financial, or trading advice. This analysis is generated from the output of Complete Intelligence’s proprietary artificial intelligence platform and does not constitute a personal recommendation. You should not base any investment decision solely on this material. Please consult with a qualified financial professional before making any investment decisions. Complete Intelligence is not liable for any actions taken based on information provided herein.